If you’ve been relying on industrial reverse osmosis (RO) systems to treat water for your manufacturing, food and beverage, pharmaceutical, or power generation operations, you know how critical consistent performance is to your bottom line, compliance, and product quality. As an industrial RO system supplier with over a decade of experience troubleshooting installations across multiple industries, I’ve seen firsthand how easily even small, unaddressed issues can escalate into costly downtime, rejected product batches, or regulatory non-compliance. The key to avoiding that pain is recognizing the early indicators of a malfunctioning system, long before a full failure brings your operations to a halt. Industrial RO System
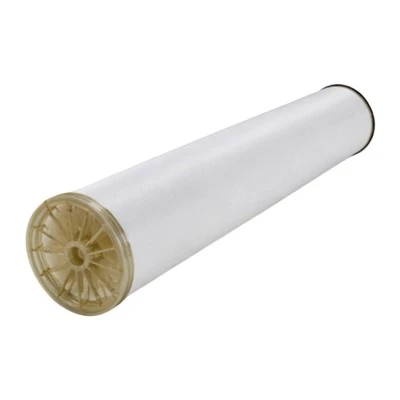
Let’s start with the basics: industrial RO systems work by forcing pressurized water through a semipermeable membrane, blocking contaminants like total dissolved solids (TDS), heavy metals, bacteria, and particulates to produce purified permeate water. When something goes wrong with this process, the symptoms aren’t always obvious at first—they start as subtle shifts in performance that can be easy to dismiss if you’re not monitoring closely. Over my time working with clients, I’ve categorized these indicators into four core groups: changes in water quality metrics, performance degradation, operational anomalies, and pre-failure wear signs.
First, let’s talk about water quality indicators. The single most common early red flag is a rising permeate TDS level. If your system’s TDS has increased 10% or more from its baseline level—say it was consistently 50 ppm and now it’s at 55 ppm, or 80 ppm jumping to 90 ppm—that’s not just a minor blip. A small TDS increase usually signals something is off with membrane integrity: tiny tears in the membrane, worn seals in the pressure vessels, or even a misaligned membrane element that’s allowing unfiltered water to slip through. I had a client in the metal finishing industry last year who didn’t catch a 12% TDS rise for three months. By the time they noticed, the contaminated permeate was ruining their plating baths, costing them over $75,000 in lost materials and rework. That’s the kind of cost you can avoid if you’re checking TDS levels weekly.
Another water quality indicator is the presence of unexpected contaminants in the permeate that weren’t in your baseline tests. For example, if your system used to consistently remove 99.5% of lead but now small traces are showing up, or if E. coli is detected in permeate that should be sterile for pharmaceutical use, that points to biofouling or membrane degradation. Biofouling is one of the most pervasive issues we see: bacteria, algae, and other microbes build up on the membrane surface over time, creating a slimy layer that not only reduces purification efficiency but can also break down the membrane’s polymer structure. If your permeate has visible particulates or a strange odor, that’s another sign—you shouldn’t see any particles in RO permeate, period.
Next, performance degradation indicators. The first big one here is a drop in permeate flow rate. Your system should produce a consistent volume of permeate per hour; if that flow drops 15% or more without a change in feed water pressure or temperature, that’s a clear warning. Flow reduction usually comes from fouling—either organic, inorganic, or scaling. Scaling is when minerals like calcium carbonate, calcium sulfate, or silica precipitate out of the feed water and form a hard crust on the membrane surface, blocking water passage. I remember a food and beverage client who had a 20% flow drop that they blamed on “normal wear” instead of scaling. We inspected the membranes and found a thick layer of calcium sulfate crust that had built up over six months; cleaning the membranes restored flow, but if they’d waited another month, the membranes would have been permanently damaged and needed replacement.
Feed pressure is another key performance metric. Industrial RO systems operate at a set feed pressure (usually 100–150 psi for standard systems, higher for high-rejection models). If your feed pressure is climbing steadily—say it’s gone from 120 psi to 145 psi over a few weeks—your system is working harder to push water through a clogged or scaled membrane, which is a sure sign of malfunction. Conversely, if feed pressure is dropping, that could point to a leak in the pressure piping, a faulty high-pressure pump, or a restriction in the feed line (like a clogged pre-filter). One of our smaller industrial clients had a pump failure that caused feed pressure to drop by 30 psi, but they didn’t notice for two weeks because they only checked flow rate once a month. By the time they replaced the pump, the reduced pressure had caused TDS levels to spike enough to contaminate their product batches, leading to a product recall.
We also track the “rejection rate” of the RO system, which is the percentage of contaminants removed. A drop in rejection rate (calculated as [(Feed TDS – Permeate TDS)/Feed TDS] x 100) is a critical performance indicator. If your rejection rate falls below your system’s design specification (usually 95–99% for standard RO), that’s almost always a membrane issue—either fouling, physical damage, or end-of-life for the membrane.
Third, operational anomalies that don’t show up in water quality or flow metrics. These are the things that happen on the floor, often when operators are interacting with the system, that can be easy to write off as minor. First, noise from the high-pressure pump. Industrial RO pumps are designed to run smoothly; if you hear grinding, knocking, or excessive vibration, that’s a sign of worn bearings, cavitation (when air gets trapped in the pump, damaging impellers), or misalignment. Cavitation is particularly damaging because it can cause sudden pressure spikes that tear at membrane surfaces, leading to premature failure. We had a client whose pump cavitated for a week before operators mentioned the noise; the resulting membrane damage required replacing half their elements, a cost of over $20,000.
Another operational red flag is frequent trips of the system’s safety controls, like high-pressure shutoff or low-pressure alarms. If your system is shutting down unexpectedly or alerting you to pressure or flow issues multiple times a week, that’s a sign the controls themselves might be malfunctioning, or that there’s an underlying problem with the pump, membranes, or piping. We once worked with a power plant client whose RO system was tripping daily, and they’d just been resetting it instead of troubleshooting. Turns out, a faulty pressure sensor was sending incorrect signals, but the repeated shutdowns had caused thermal stress on the membrane elements, reducing their lifespan by 30%.
We also keep an eye on the concentrate (brine) flow rate. The concentrate is the water that’s left after purification, which is sent to a drain or reuse system. If the concentrate flow is too low, that can cause the concentrate to become too concentrated, leading to scaling on the membranes. If the concentrate flow is too high, that means you’re wasting water (a big deal for operations in water-scarce regions) and might not be achieving enough crossflow to prevent fouling.
Finally, pre-failure wear signs that are easy to spot with regular maintenance. These are the subtle signs that the system is nearing the end of its usable life or has recurring issues. For example, if pre-filters (like sediment or carbon filters) are clogging much faster than their replacement schedule—say you’re changing a 5-micron sediment filter every two weeks instead of every two months— that means there’s a higher level of particulates in the feed water, or a problem with the system’s pre-treatment. Pre-treatment is the first line of defense for RO systems, and if it’s not working, it will cause all kinds of membrane issues. We often recommend clients test their pre-treatment systems when they notice accelerated filter clogging, because fixing pre-treatment can extend membrane life by 2–3 years.
Another pre-failure sign is visible damage to membrane housings or piping. Cracks in pressure vessels, loose fittings, or worn O-rings might seem minor, but they can lead to leaks that allow unfiltered feed water to mix with permeate, causing TDS levels to spike. We had a beverage client who had a small crack in a pressure vessel that they didn’t notice for months; the crack was only 1/8 inch wide, but it allowed feed water to bypass the membrane, leading to a 25% TDS rise that ruined their soda concentrate batches. Regular visual inspections (we recommend doing them every week) can catch these issues before they become costly.
Now, I want to be clear: some of these indicators are normal parts of an RO system’s lifecycle. For example, TDS will naturally rise slightly as membranes age, and pre-filters will clog over time. The key is knowing the baseline performance of your system and acting when deviations are significant. We always tell clients to keep a log of their daily metrics: feed pressure, permeate flow, TDS, concentrate flow, and pump noise. That log will help you spot trends instead of single-point anomalies. For example, a one-day TDS spike might be a temporary feed water issue, but a three-week upward trend is a clear sign of membrane degradation.
As an industrial RO system supplier, we don’t just sell equipment—we help clients avoid costly downtime by recognizing these issues early. We’ve seen that when clients address these indicators proactively, they can reduce membrane replacement costs by up to 40% and avoid 90% of unplanned shutdowns. Waiting until the system fails not only costs more in repairs and replacements but can also lead to regulatory fines (for industries like pharmaceuticals or water treatment) or product loss, which is far more damaging than addressing a minor issue right away.
If you’re noticing any of these signs in your industrial RO system, don’t wait until it’s too late. Reaching out to a trusted industrial RO system supplier for a system audit can help you identify the root cause of the issue before it escalates. We’ve helped dozens of clients diagnose problems like hidden scaling, pump cavitation, or worn seals early, saving them tens of thousands of dollars in avoidable costs.

If you want to discuss your industrial RO system’s performance, review your daily metrics, or explore solutions to address any indicators of malfunction, we encourage you to connect with our team to start a conversation about your needs. Our experts will work with you to assess your system, provide a clear breakdown of any issues, and recommend tailored solutions to keep your operations running smoothly.
Hot Water RO Membrane References
- Membrane Technology and Research, Inc. (2021). Industrial Reverse Osmosis System Operation and Maintenance Guidelines.
- Water Quality Association. (2022). Troubleshooting Reverse Osmosis Systems for Commercial and Industrial Applications.
- World Health Organization. (2020). Guidelines for the Safe Use of Reverse Osmosis Systems in Pharmaceutical Water Production.
- American Water Works Association. (2019). Fouling and Scaling in Industrial Membrane Systems: Causes, Prevention, and Mitigation.
Fujian Huamo Technology Co., Ltd.
Fujian Huamo Technology Co., Ltd. is one of the most professional industrial ro system manufacturers and suppliers in China, featured by quality products and good service. Please rest assured to wholesale the best industrial ro system made in China here and get price list from our factory. Contact us for custom service and OEM service.
Address: No.6 Hengtong Rd, Shanmei Village, Xiamei Town, Nanan City, Fujian Province, China
E-mail: info@huaromembrane.com
WebSite: https://www.hmromembrane.com/
